Stop Guessing Why Your PowerShell Is Slow
Meet Profiler, a PowerShell profiler that traces scripts and module functions to show where time actually goes. It splits SelfDuration from Duration, separating a function's own cost from its callees. DevOps engineers and module authors: stop guessing. A demo showed 98.6% of runtime in one Invoke-WebRequest. Export it as a speedscope flame graph.
More signals
Learning & Reference01
Watch The Code That Took Us to the Moon 🚀🌕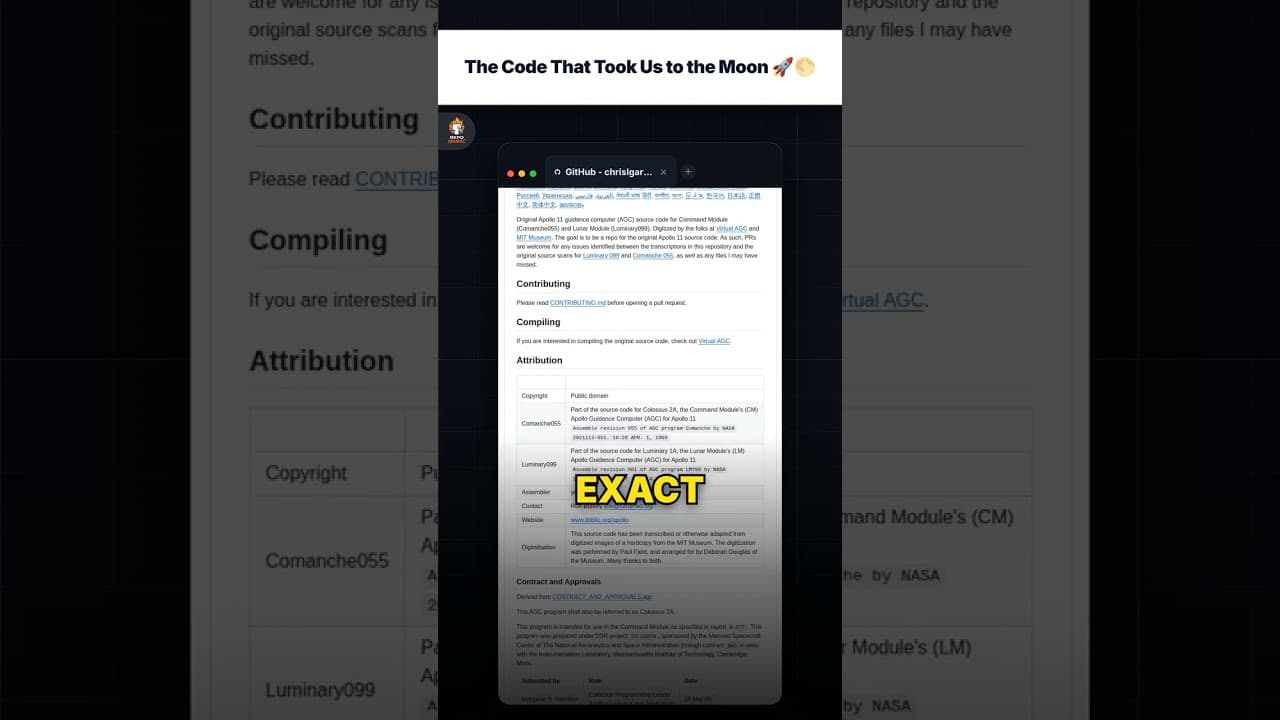
The Code That Took Us to the Moon 🚀🌕
00:30Sep 09, 2026score99
Learning & Reference02
Watch Anthropic's Accident is Your Masterclass: Inside Claude Code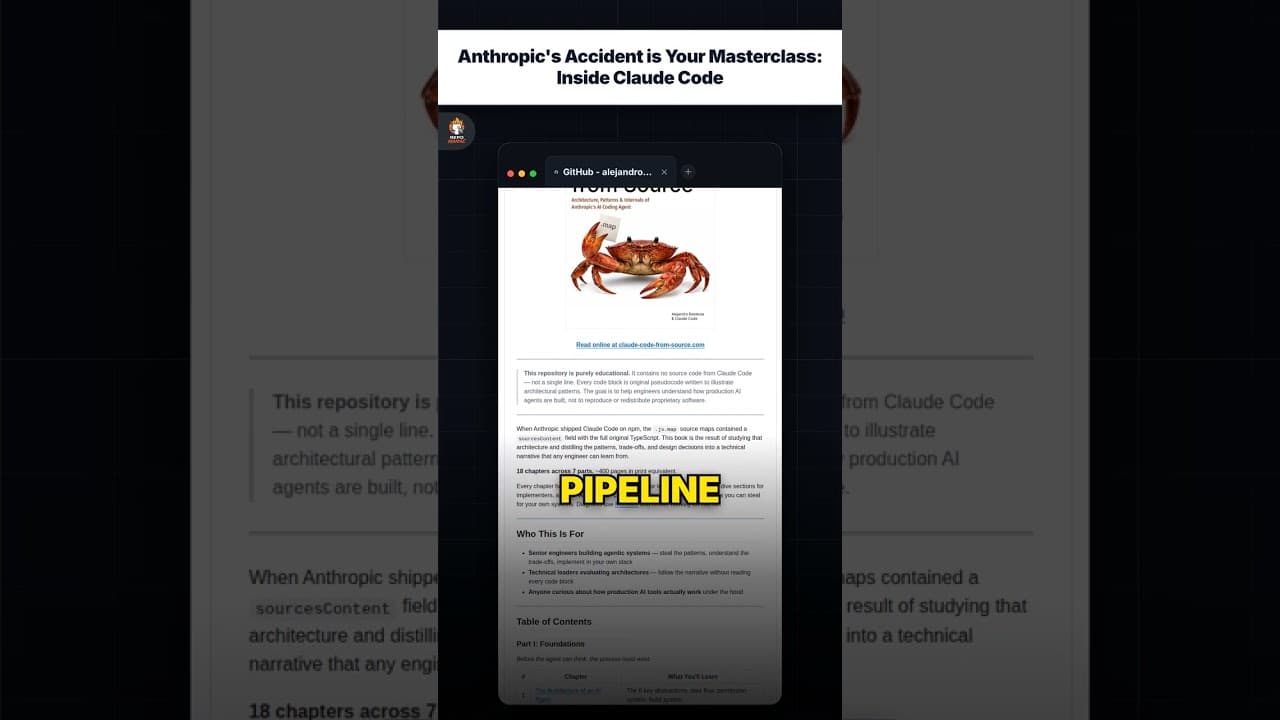
Anthropic's Accident is Your Masterclass: Inside Claude Code
00:35Sep 07, 2026score98
AI & Machine Learning03
Watch Cure AI Amnesia with Garry Tan's gbrain
Cure AI Amnesia with Garry Tan's gbrain
00:35Sep 07, 2026score98